Classification is the Supervised learning task where the output is a discrete category, not a continuous number. Is this email spam? is a yes/no question. Is this wine high quality or low quality? is yes/no. Does this patient have diabetes? same.
 Two-class data in 2-D with a linear decision boundary.
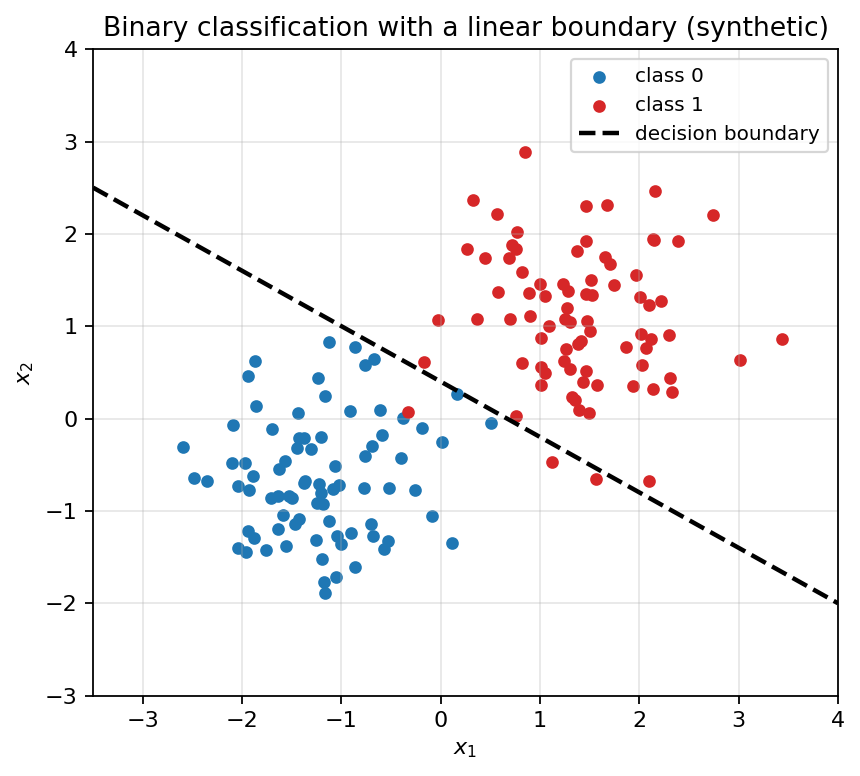
The simplest case is binary classification: two possible classes, conventionally labelled 0 and 1. The model takes input features and predicts which class the example belongs to. Multi-class classification generalizes to more than two classes (handwritten digit recognition has 10 classes; ImageNet has 1000).
Why plain regression doesn’t work
A natural first attempt at binary classification is to use Regression: fit a linear function to the data and threshold the output to get a class. This has problems.
The class labels are 0 or 1. A linear function takes values from to , so most of its outputs aren’t 0 or 1; they’re real numbers like 0.3 or 1.7 or . We could threshold at 0.5 (predict 1 if , else 0) but the regression line gets pulled around by outliers, and the implicit threshold shifts dramatically.
We need a model whose output is naturally bounded between 0 and 1, so we can read it as a probability (the probability that this example is class 1) and threshold at 0.5 to get a class prediction.
The fix: sigmoid
The Sigmoid function maps the real line to in an S-shape. Wrapping a linear function in a sigmoid gives us Logistic regression:
The output is now bounded between 0 and 1 and makes sense as a probability. Threshold at 0.5 to get a class.
Training
Logistic regression is trained with Gradient descent, using Binary cross-entropy as the loss function — not Mean squared error, because MSE combined with sigmoid produces a non-convex loss surface with bad local minima. Cross-entropy gives a convex surface where gradient descent reliably finds the global optimum.
Evaluation
A classifier is evaluated with a richer set of metrics than a regressor:
- The Confusion matrix records TP, TN, FP, FN counts.
- Accuracy, recall, precision, F1 score each summarize a different aspect of behaviour.
- The ROC curve and AUC characterize performance across all thresholds, not just 0.5.
We need so many metrics because good means different things in different applications. A spam filter cares about precision (don’t classify legitimate email as spam). A cancer screen cares about recall (don’t miss any cancers). Accuracy alone hides this: a 99%-accurate classifier on a 99%-imbalanced dataset can be doing nothing useful.
In scikit-learn: sklearn.linear_model.LogisticRegression, plus the evaluation helpers in sklearn.metrics.