AUC (Area Under the Curve) is a single-number summary of an ROC curve: the area between the curve and the x-axis, ranging from 0 to 1. It’s the standard threshold-independent classification metric.
The reference values:
- AUC = 1.0: perfect classifier. The ROC curve hugs the top-left corner; the area under it is the full unit square.
- AUC = 0.5: random classifier. The ROC curve traces the diagonal; the area under it is half the unit square.
- Real classifiers fall between 0.5 and 1.0, with higher being better.
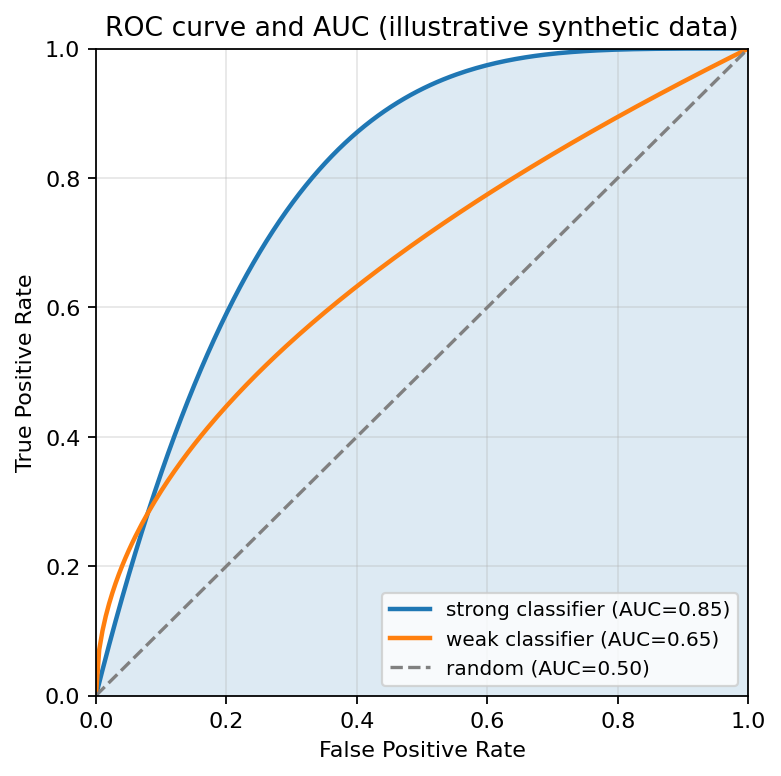 ROC curves at three skill levels. AUC is the area under each curve; a perfect classifier reaches the top-left corner.
(An AUC below 0.5 is possible. It means the classifier is worse than random, but in practice we’d just flip its predictions and recover an AUC above 0.5.)
Equivalent interpretation
AUC has a useful interpretation that doesn’t require thinking about the threshold sweep:
AUC equals the probability that the classifier ranks a randomly-chosen positive example higher than a randomly-chosen negative one.
- AUC = 0.5 means the classifier is no better than a coin flip at this comparison.
- AUC = 1.0 means the classifier always gets the comparison right.
- AUC = 0.80 means the classifier ranks the positive higher 80% of the time.
This ranking interpretation is sometimes more intuitive than area under a curve. It’s also why AUC is largely insensitive to class imbalance: it doesn’t depend on how many of each class there are, only on whether positives tend to be ranked higher.
Why AUC over accuracy
Two reasons to prefer AUC as a headline metric:
- AUC is threshold-independent. Accuracy depends on the chosen threshold (0.5 by default). AUC averages over all thresholds.
- AUC isn’t fooled by class imbalance the way accuracy is. A trivial classifier on a 99/1 imbalanced dataset gets 99% accuracy by always predicting the majority class. The same classifier has AUC 0.5, random.
For most binary-classification problems, AUC alongside the Confusion matrix is a more honest summary than accuracy alone.
In scikit-learn
from sklearn.metrics import roc_auc_score
auc = roc_auc_score(y_test, y_prob)
y_prob is the predicted probability of the positive class (not the hard prediction).
For multi-class classification, roc_auc_score supports several averaging strategies ('ovr' for one-vs-rest, 'ovo' for one-vs-one) via the multi_class= parameter.
A typical interpretation
A wine-quality classifier from the Introduction to Data Science textbook achieves AUC ≈ 0.80. The interpretation: if we pick a random high-quality wine and a random low-quality wine, the classifier ranks the high-quality one higher 80% of the time. That’s a usable level of performance for many applications, well above the random baseline of 0.5 and well below the perfect 1.0. Whether it’s good enough for a specific application depends on the costs of mistakes, the same threshold-by-application reasoning that comes up everywhere in classifier evaluation.