A state diagram is the graphical form of a finite state machine. States are circles (or ovals), transitions between states are arrows, and labels on the arrows say what input triggers each transition.
For a Moore machine, outputs are written inside the state bubble (the output is fixed by the state). For a Mealy machine, outputs are written on the transition arrows (the output is fixed by the state-and-input combination), in input/output form.
Example
A “detect two consecutive 1s” sequence detector as a Moore machine:
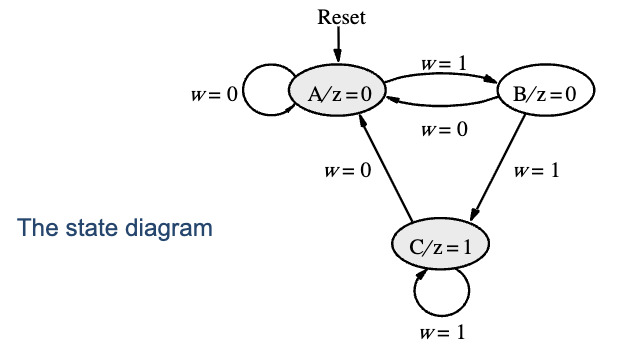
Three states: A (reset/idle), B (just saw one 1), C (saw two 1s in a row). The label A/z=0 means “in state A, output z = 0.” Transition arrows are labeled with the input condition.
Reading the diagram:
- From A on input 0, stay at A.
- From A on input 1, go to B.
- From B on input 0, return to A.
- From B on input 1, go to C (the second consecutive 1 has arrived).
- From C on input 0, return to A.
- From C on input 1, stay at C.
A “Reset” arrow points into A from outside, indicating the initial state on power-up.
What it captures
A state diagram answers:
- What states does the machine have?
- What inputs trigger transitions between them?
- What outputs does each state (Moore) or transition (Mealy) produce?
It does not directly say:
- How many bits encode each state (that’s state assignment).
- Which flip-flop type stores the state.
- What gate-level logic implements the next-state and output functions.
Those come later in the design flow.
Why use it
State diagrams are the natural form for thinking through an FSM design. You can draw one on a whiteboard while talking through the desired behavior, and it reads like a flowchart. The next step, translating to a state table and then to gates, is mechanical once the diagram is right.
Reading and drawing state diagrams is also the standard way to communicate FSM behavior in engineering documentation. A correctly drawn state diagram is unambiguous: anyone who can read it can reproduce the same circuit.
Sequence detector (FSM design example) walks through the full state diagram → state table → gates translation for the example above.