A stacked bar chart is a Bar chart where each bar is divided into segments stacked on top of one another. Each segment represents a part of the whole that the bar represents. Total sales per month, with each bar split into segments by product type, is a stacked bar chart: one bar per month, each bar partitioned by product.
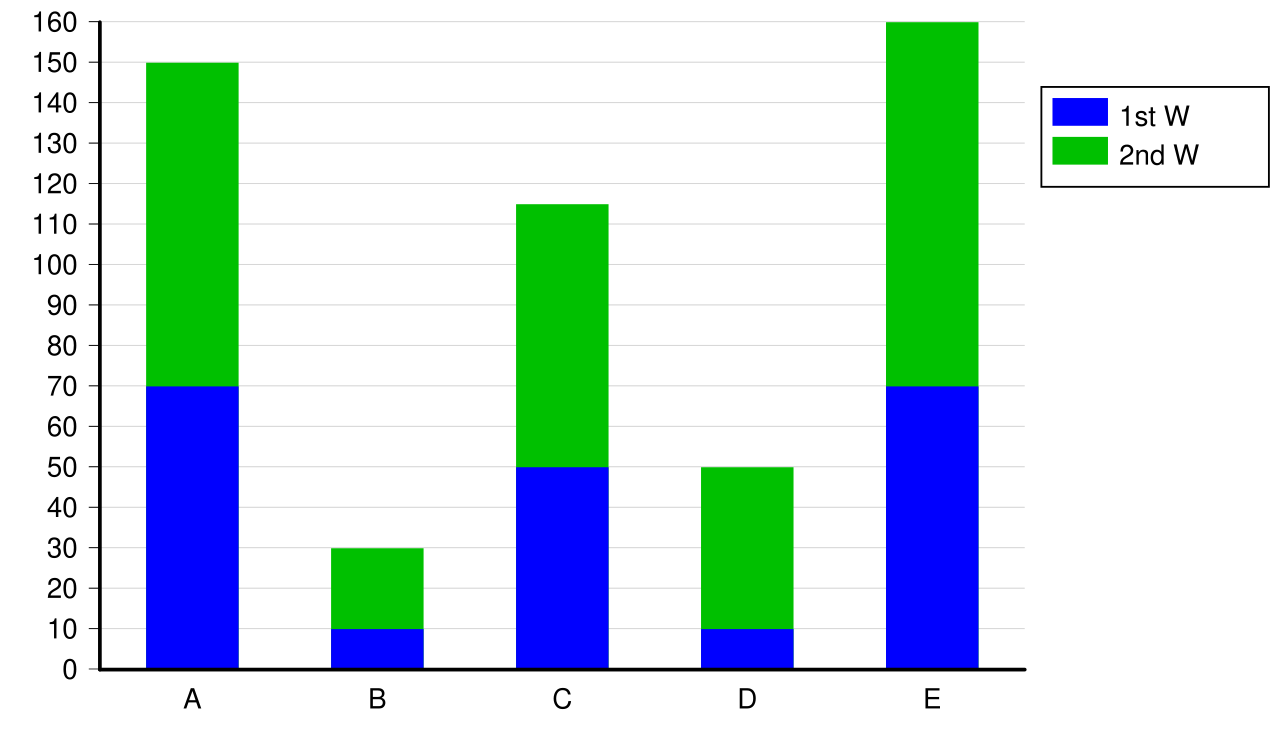 Image: Stacked bar chart, CC BY-SA 3.0
The strength of stacked bars is that they show both the total and the composition in one chart. The reader sees how the total grows or shrinks across categories, and within each category, how much each segment contributes.
The weakness is that comparing the second-from-bottom (or any non-bottom) segments across multiple bars is hard, because they don’t share a common baseline. Eye-balling whether segment B grew from January to February requires mentally subtracting the segment A heights from each bar, much harder than comparing two bars that both start at zero.
The rule of thumb:
- Composition matters more than segment comparison: stacked bars are right.
- Segment-to-segment comparison matters more than the total: grouped bars (segments drawn side by side, all starting at zero) are clearer.
When there are more than a handful of segments per bar, stacked bars become hard to read at any task. The chart turns into a wall of colored rectangles where individual segments blur together. In that regime, a Heat map or a small-multiples grid of bar charts usually beats either stacked or grouped layouts.
A common variant is the 100% stacked bar chart, where each bar is scaled to the same total height and the segments show proportions rather than absolute values. Use it when the message is what fraction of each month was product A and not which month had the most product A.
In Matplotlib, stacked bars are built by passing a bottom= argument to successive ax.bar(...) calls. Each subsequent series starts from the cumulative height of the previous ones.