Normalization is a preprocessing transformation that gives every column of data zero mean and unit standard deviation, regardless of the original units or scale. It’s sometimes called the z-score operation, because the formula it computes is exactly the z-score from elementary statistics: how many standard deviations is this value above or below the mean. More precisely this is standardization; the word “normalization” gets used in both senses (see below).
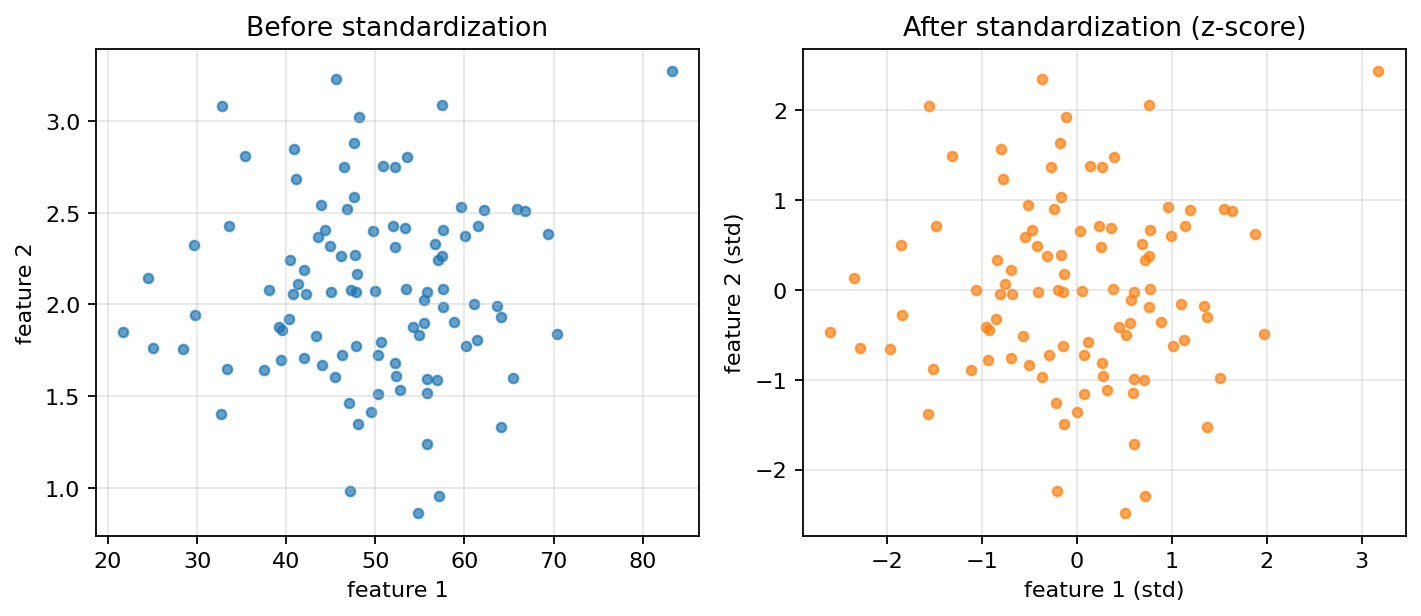 Before vs after z-score standardisation. Distance-based methods benefit when features share scale.
Naming warning. The literature uses “normalization” for at least two different operations: the zero-mean/unit-variance transform described here (technically standardization), and min-max scaling that squashes a column into . Scikit-learn keeps the two strictly separate: StandardScaler does the zero-mean/unit-variance form; MinMaxScaler does the min-max form. Introduction to Data Science uses “normalization” to mean the z-score form, matching the StandardScaler convention.
The motivation: suppose we have ECG and EEG data from two different recording days. The amplifier gain on day one was different from day two, the electrode contact resistance was different, the patient was wearing a different shirt that picked up a slightly different amount of electrical noise. The actual physiological signal might be identical, but the recorded voltages will differ. A model that compares raw voltages would conclude the two days are showing different signals, when in fact they’re showing the same signal at different scales. Normalization fixes this: after normalization, a heartbeat looks like a heartbeat regardless of the original gain.
The math, step by step
Take a one-dimensional signal with samples. We want a normalized signal with mean zero and standard deviation one. Two phases.
Phase 1: subtract the mean. Compute the mean, , then subtract from every sample:
The notation is shorthand for subtract from every element of . The new signal has the same shape as but is shifted vertically so its mean is zero. Peaks and troughs are in the same positions; the curve has just been moved down by .
Phase 2: divide by the standard deviation. Compute
and form
After this division, has mean zero and standard deviation one. It’s also dimensionless: we divided a quantity in volts by another quantity in volts, and the units cancelled.
For a multi-column dataset, apply the procedure to each column independently. After normalization, every column has mean 0 and standard deviation 1, and a model that compares columns is comparing them on a level playing field.
Why this matters for models
Many algorithms (PCA, Logistic regression, neural networks) are sensitive to feature scale. A feature measured in millimetres and a feature measured in metres contribute very differently to variance and to gradients, and the model’s behaviour ends up dominated by whichever feature happens to have the largest numbers. Normalization removes this artifact.
In scikit-learn
StandardScaler does the arithmetic above:
from sklearn.preprocessing import StandardScaler
sc = StandardScaler()
data_normalized = sc.fit_transform(data)
fit_transform does two things at once: it fits the scaler (measures the mean and standard deviation of every column) and transforms the data (applies the formula above). The result is a NumPy array with each column normalized.
Pitfall: fit on training data only, not the entire dataset. Fitting on the entire dataset before a test split leaks information from the test set into the scaler (the test-set mean and standard deviation contribute to the scaling parameters), and the test set is no longer the unseen evaluation it’s supposed to be. This is Data leakage. The fix: split first, fit on training only, then transform both training and test sets using the training-fitted scaler. In scikit-learn, this is the difference between fit_transform (training only) and transform (test data).