A Venn diagram uses overlapping circles to show set membership and the relationships between sets. Each circle is a set; the regions inside, and the overlaps, are the elements that satisfy combinations of set memberships. Shading particular regions shows the elements that satisfy a Boolean expression or set operation.
Named after John Venn (1880), who formalized them as a tool for visualizing logical syllogisms.
Anatomy
For two sets and , a Venn diagram has four regions:
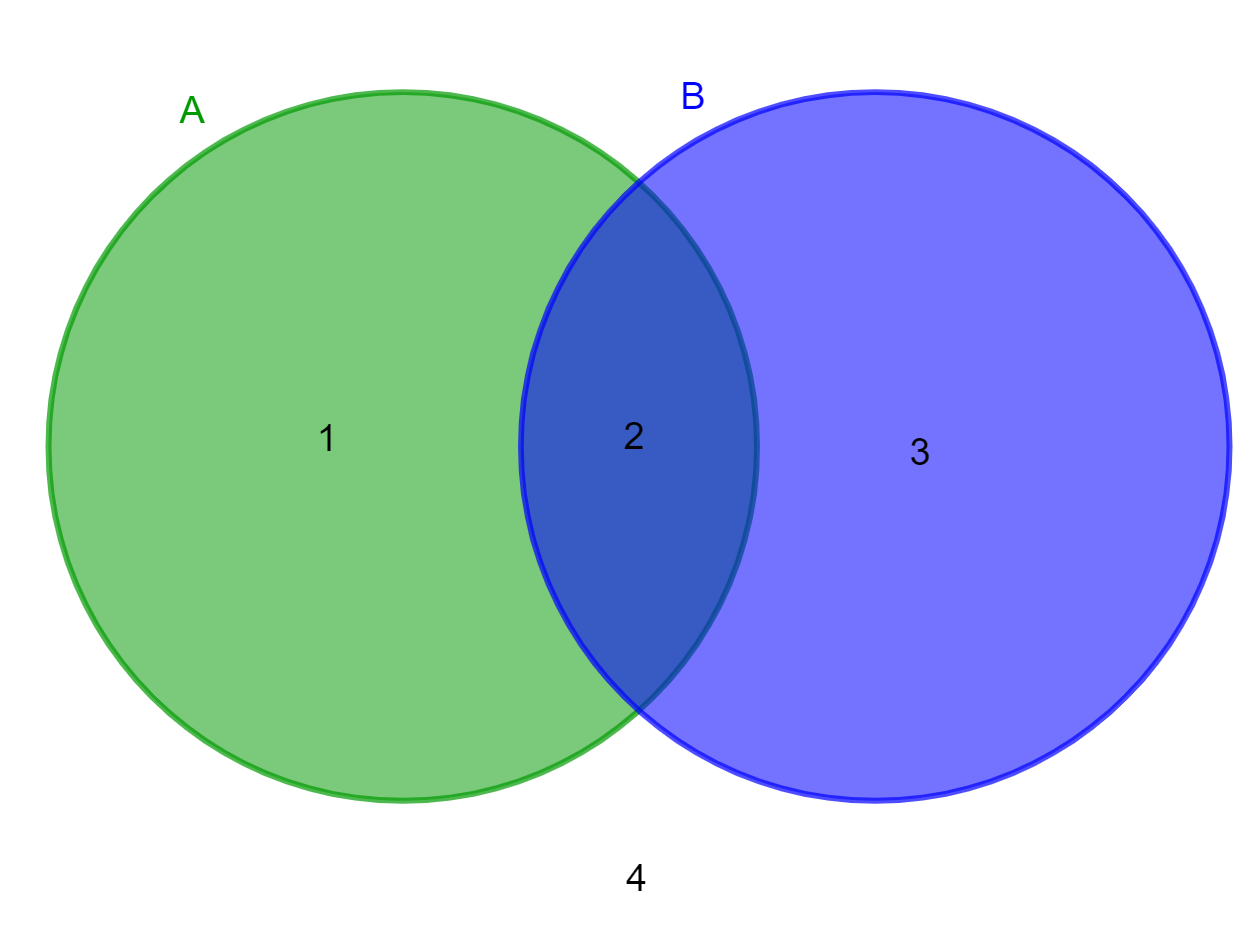 Image: Venn diagram with labeled regions, CC0 / public domain
- — inside only (in , not in ).
- — inside both (the intersection).
- — inside only.
- Outside both circles — not in and not in (the universal complement).
For three sets, you get regions (including the “outside everything” region).
For sets you need distinct regions, but circles only reach that up to 3 sets. For 4 sets you need ellipses; for 5 or more, more elaborate curve shapes, and the diagrams become hard to read.
Set operations as Venn shadings
| Operation | Notation | Shading |
|---|---|---|
| Union | All of + all of . | |
| Intersection | Overlap region only. | |
| Difference | but not , the left crescent. | |
| Symmetric difference | Either circle’s exclusive region (not the overlap). | |
| Complement | or | Everything outside . |
Boolean algebra correspondence
Set operations map directly onto Boolean operations:
- Union ↔ OR ().
- Intersection ↔ AND ().
- Complement ↔ NOT ().
- Universal set ↔ Boolean .
- Empty set ↔ Boolean .
Shading the regions for a Boolean function shows the inputs for which the function is true.
Verifying Boolean identities
A Venn diagram gives a quick visual proof of Boolean equivalences. Example: distributivity, .
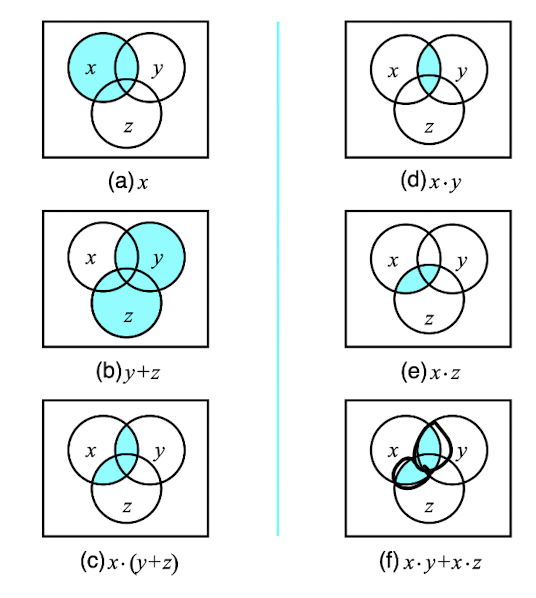
The PDF figure walks through both sides:
- Panels (a)-(c): shade , then , then their AND. Result: the part of overlapping or .
- Panels (d)-(f): shade (X and Y overlap), then (X and Z overlap), then their OR. Result: ‘s portion overlapping with anything in or .
Both shadings match. Distributivity confirmed visually.
Why Venn diagrams scale poorly
For 2 sets: 4 regions. Two intersecting circles work fine.
For 3 sets: 8 regions. Three intersecting circles give exactly 8 (including the outside), a perfect fit.
For 4 sets: 16 regions. You can’t get all 16 distinct regions from 4 intersecting circles in general position. At most 14 are achievable, so two of the required combinations of memberships go unrepresented. Use ellipses or other curve shapes to recover all 16.
For 5+ sets: technically possible but visually impossible to interpret.
This is why Venn diagrams are limited to 3-set examples in textbooks. For larger problems, K-maps take over: the same logical content laid out as a grid where adjacent cells differ by one variable, scalable to any number of variables.
Worked examples
Verifying De Morgan’s Law
LHS: shade outside the union of and , i.e. everything outside both circles.
RHS: shade (everything outside ) AND (everything outside ). The intersection of those two complements is everything outside both.
Same region. ✓
Three-set associativity
. Both shade the union of all three circles.
Trivially true; the parenthesization doesn’t matter for union.
Beyond Boolean: probability
Venn diagrams are also used to visualize probability:
- Region areas (in a “scaled” Venn diagram) represent probabilities.
- . The inclusion-exclusion formula corresponds to “add the circles, subtract the overlap (counted twice).”
In probability courses, Euler diagrams (which can show empty intersections) are often used instead of strict Venn diagrams.
Limitations
Venn diagrams give intuition, not rigor. They’re great for:
- Building intuition about Boolean operations.
- Verifying simple identities by inspection.
- Teaching set theory.
They’re poor for:
- Formal proofs (need algebraic manipulation).
- Many variables (5+).
- Computing complex expressions (use truth tables or K-maps).