A decision tree is a graphical model of a sequence of decisions and chance events, with probabilities and payoffs attached, used to find the choice that maximises expected value (or some other criterion). It’s the standard tool for decisions under risk, where probabilities of outcomes are known or can be estimated.
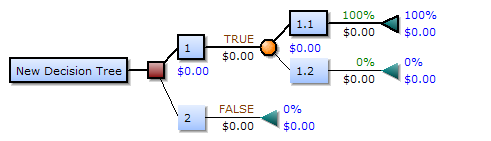 Image: Elements of a decision tree, public domain — decision nodes (squares), chance nodes (circles), and end nodes.
Components of the tree:
- Decision node (square): a choice the analyst controls. Branches leaving a square represent the options.
- Chance node (circle): an uncertain event with known probability distribution. Branches leaving a circle represent possible outcomes, each labelled with its probability.
- Branches (lines): connections between nodes, showing the sequence of decisions and events.
- Leaves (terminal nodes): final payoffs at the end of each path through the tree.
A simple example. We’re choosing between buying Machine A or Machine B. Each has uncertain returns: high (probability 30%), medium (50%), low (20%). We draw a square (the choice), two branches (A or B), then a circle off each branch with three sub-branches and probabilities, ending in payoff numbers at the leaves.
Folding back. To solve the tree, work from leaves backward toward the root.
- At each chance node, compute the expected value: .
- At each decision node, pick the option with the highest expected value, and propagate that value upward.
- The root’s value is the optimal expected payoff, and the path through the tree shows the decision policy that achieves it.
Strengths. Handles sequential decisions naturally, which helps when the decision unfolds over time and what you do at step 2 depends on what happened at step 1. Forces you to write down probabilities and payoffs, which itself surfaces hidden assumptions.
Weaknesses. Trees grow exponentially with depth and quickly become unmanageable past a handful of stages. Needs probability estimates that are often guesses dressed up in numbers. Doesn’t handle continuous variables (use Monte Carlo simulation for that).
Common pitfall. Treating expected value as the certain outcome. EV is the average over many trials of the decision; any single instance can produce any of the leaf outcomes. A decision tree pick may be the best in expectation but still produce a bad result in this particular case. EV maximisation is the right policy across many similar decisions; for one-off decisions with downside-skewed payoffs, additional risk-aversion considerations apply.
The folding-back step relies on Expected value (engineering economics).