A cash flow diagram shows when each cash flow in a project happens and in which direction. Horizontal axis is time; each cash flow is a vertical arrow at the period it occurs. Inflows go up, outflows go down, and the arrow length (or its dollar label) conveys magnitude.
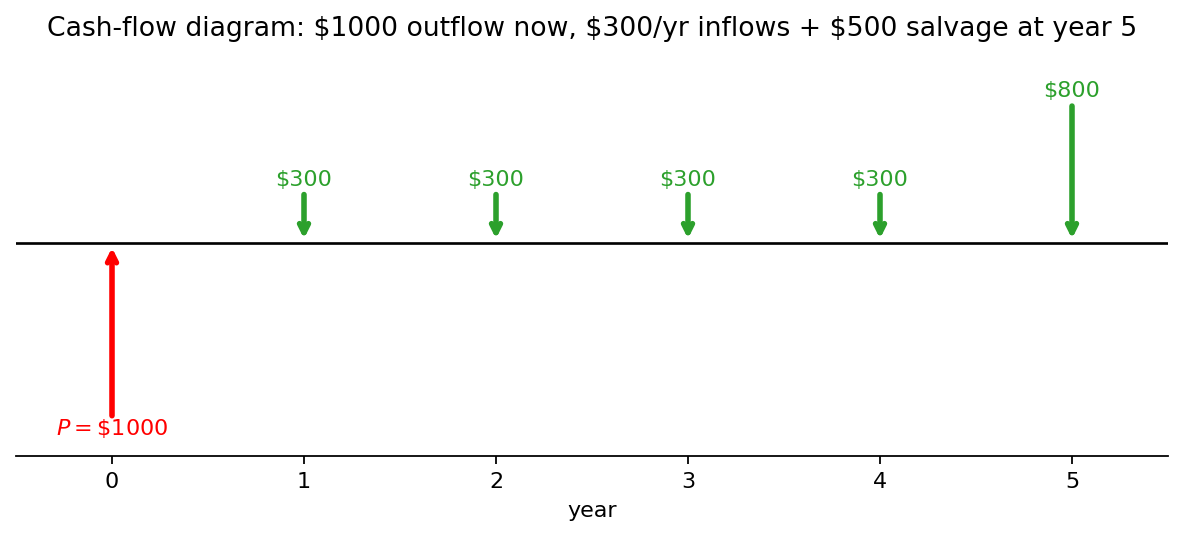 Cash-flow diagram convention: downward arrows = outflows, upward = inflows; time on horizontal axis.
The conventions, mostly inherited from accounting:
- Cash flows go at the end of the period they occur in. A payment “in year 3” sits at the right edge of the year-3 column, between years 3 and 4 on the cumulative axis. The whole period acts as a discrete tick on the timeline.
- Time zero is “now”, the present moment of the analysis. Future periods are positive integers running right; past periods (if shown) are negative running left.
- Don’t net inflows against outflows in the same period. Draw them as separate arrows in opposite directions. Net them only after you’ve moved everything to a common point in time using the interest factors.
Once the diagram is drawn, picking the right compound-interest factor is mechanical: a single one-shot payment uses or , a constant series of equal payments uses the annuity factors , , , , an arithmetic-gradient pattern uses or , and so on.
A clean worked example: a five-year project with $80,000 up front at , $25,000/year operating revenue at the end of years 1-5, a $15,000 mid-life overhaul at end of year 3, and $10,000 salvage at end of year 5. The diagram has one tick per year from 0 to 5. At : a single downward arrow labeled $80,000. At : upward arrows of $25,000 each. At : two separate arrows, a +$25,000 revenue up and a $15,000 overhaul down (not netted to +$10,000, see below for why). At : a second upward arrow of $10,000 for salvage, separate from the revenue. Once drawn, the PW becomes a mechanical sum: .
Common mistake: pre-netting inflows and outflows within a period. In the example, if you’d combined year 3’s flows into a single +$10,000 arrow, you’d compute the right PW for that period, but you’d lose the information that the $15,000 overhaul is a separate decision (sourced separately, taxed separately, possibly scheduled differently). Keep them as distinct arrows until you’ve collapsed the diagram to a single PW.
Common mistake: mismatched compounding and payment periods. If interest compounds monthly but the cash flows arrive annually, you have to convert the monthly rate to an effective annual rate before applying with in years. See Nominal vs effective interest rate for the conversion machinery.
Collapsing a diagram to a single PW or AW number is handled by the Present worth method.